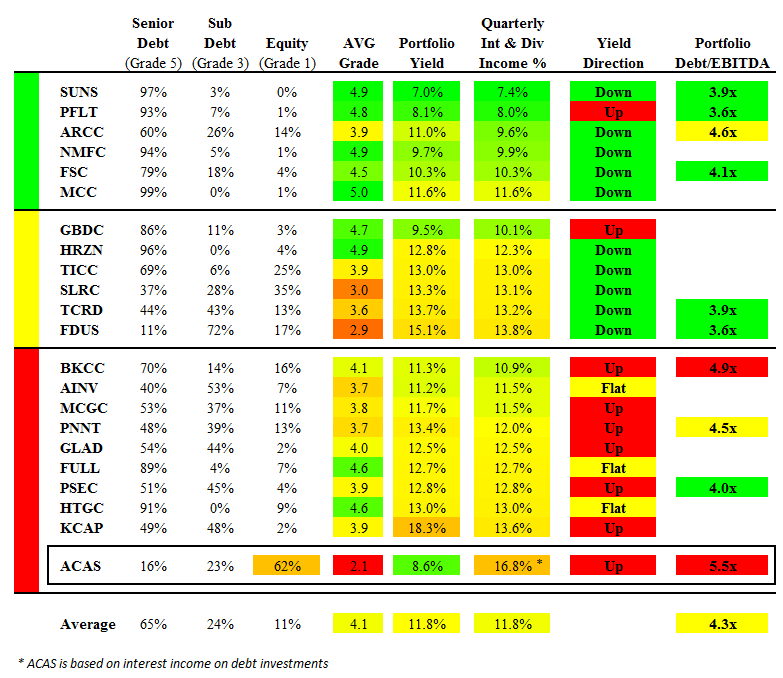
What we have here below is a chart that BDC Buzz put together that I linked to on seekingalpha.com. What is interesting to me is the averages. The average portfolio Yield is 11.8% and the average portfolio debt/ebitda is 4.3x. We can assume that on average these are stable businesses, I suppose just for the sake of maths.
For any company that has $1M in EBITDA, on average the debt is $4.3M and the annual interest payments on that debt are $0.507M. Means like an interest coverage ratio of 2.0x, on average.
I am used to seeing 3.1x-3.8x in Total Debt/EBITDA multiples with 2.2x-2.6x in Senior Debt/EBITDA multiples coming out with a total EV/EBITDA multiple of 5.9x-6.8x for generally stable businesses.

Note that Warren Buffett recently did Heinz at TEV/EBITDA of 14X and SR. DEBT/EBITDA of like 6.5X and then Total Debt/ebitda if you include his preferreds at 10.2X that pay 9%.
Idearc was at 7.0x and RHD was at 9.0X in terms of debt/ebitda a few years ago.
